Toronto Housing Starts in February 2016
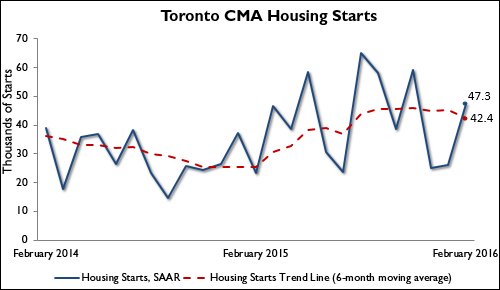
Author: Toronto Real Estate Admin / Category: News BulletinTORONTO, March 8, 2016 — Housing starts in the Toronto Census Metropolitan Area (CMA) trended at 42,352 units in February 2016 compared to 45,296 in January 2016 according to Canada Mortgage and Housing Corporation (CMHC). The trend is a six month moving average of the monthly seasonally adjusted annual rates (SAAR) of housing starts.
“While housing starts in Toronto trended lower in February, low listings of single-detached homes in the resale market have resulted in some demand being carried over to the new home market as indicated by higher trending single-detached home starts, ” said Dana Senagama, CMHC Principal Market Analyst for the GTA.
CMHC uses the trend measure as a complement to the monthly SAAR of housing starts to account for considerable swings in monthly estimates and obtain a complete picture of the state of the housing market. In some situations, analysing only SAAR data can be misleading in some markets, as they are largely driven by the multiples segment of the markets which can be quite variable from one month to the next.
The standalone monthly SAAR was 47,341 units in February, up from 26,120 units in January. The increase was the result of greater apartment starts.
With 2,101 new apartment units breaking ground within the City of Toronto meant it recorded the highest number of starts within the GTA. Brampton recorded the next highest number of starts comprising mostly single-detached units. This was followed by Mississauga, where apartment construction was robust.
Preliminary Housing Starts data is also available in English and French at the following link: Preliminary Housing Starts Tables
As Canada’s authority on housing, CMHC contributes to the stability of the housing market and financial system, provides support for Canadians in housing need, and offers objective housing research and information to Canadian governments, consumers and the housing industry.
For more information, or follow us on Twitter, YouTube, LinkedIn and Facebook.
Information on this release:
Media Contact:
Angelina Ritacco
416-218-3320
Cell: 647-210-7420
aritacco@cmhc.ca
Additional data is available upon request.
Source: CMHC
1 Census Metropolitan Area
2 The trend is a six-month moving average of the monthly seasonally adjusted annual rates (SAAR). By removing seasonal ups and downs, seasonal adjustment allows for a comparison from one season to the next and from one month to the next. Reporting monthly figures at annual rates indicates the annual level of starts that would be obtained if the monthly pace was maintained for 12 months. This facilitates comparison of the current pace of activity to annual forecasts as well as to historical annual levels.
Detailed data available upon request
Source: CMHC
Source: CMHC
Article source: http://www.cmhc.ca/en/corp/nero/nere/2016/2016-03-08-0816b.cfm