January 2015 Housing Starts in Toronto
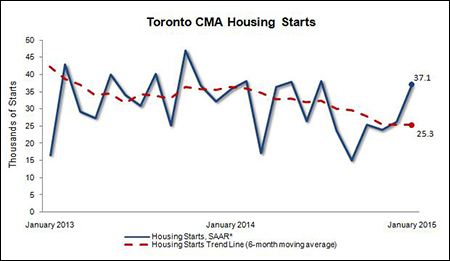
Posted by: Toronto Real Estate Admin / Category: News BulletinTORONTO, February 9, 2015 — Housing starts in the Toronto Census Metropolitan Area (CMA) trended at 25,290 units in January compared to 25,480 in December 2014 according to Canada Mortgage and Housing Corporation (CMHC). The trend is a six month moving average of the monthly seasonally adjusted annual rates (SAAR)1 of housing starts.
“Toronto housing starts in January 2015 continued to trend at a similar level compared to the previous month. However, condominium apartment starts reached an eleven month high,” said Dana Senagama, CMHC’s Toronto Senior Market Analyst. “The recent bounce back in high rise starts activity has been expected due to an increase in pre-construction high-rise sales since mid-2013”.
CMHC uses the trend measure as a complement to the monthly SAAR of housing starts to account for considerable swings in monthly estimates and obtain a more complete picture of the state of the housing market. In some situations, analysing only SAAR data can be misleading in some markets, as they are largely driven by the multiples segment of the markets which can be quite variable from one month to the next.
The stand alone monthly SAAR was 37,102 units in January 2015, up from 26,321 units in December 2014. The increase was the result of a significant increase in apartment starts.
The City of Toronto recorded the highest number of starts in January, made up of mostly condominium apartments. The next highest level of starts was recorded in Vaughan, which saw the next largest number of condominium apartment units begin construction. This was followed by Brampton, which recorded the highest number of single-detached home starts.
Preliminary Housing Starts data is also available in English and French at the following link: Preliminary Housing Starts Tables.
As Canada’s authority on housing, CMHC contributes to the stability of the housing market and financial system, provides support for Canadians in housing need, and offers objective housing research and information to Canadian governments, consumers and the housing industry.
1 All starts figures in this release, other than actual starts and the trend estimate, are seasonally adjusted annual rates (SAAR) — that is, monthly figures adjusted to remove normal seasonal variation and multiplied by 12 to reflect annual levels. By removing seasonal ups and downs, seasonal adjustment allows for a comparison from one season to the next and from one month to the next. Reporting monthly figures at annual rates indicates the annual level of starts that would be obtained if the monthly pace was maintained for 12 months. This facilitates comparison of the current pace of activity to annual forecasts as well as to historical annual levels.
Information on this release:
Market Analysis Contact:
Dana Senagama
416-218-3328
dsenagam@cmhc.ca
Media Contact:
Beth Bailey
416-218-3355
bbailey@cmhc.ca
Follow CMHC on Twitter @CMHC_ca
Additional data is available upon request.
Source: CMHC
1 Census Metropolitan Area
2 The trend is a six-month moving average of the monthly seasonally adjusted annual rates (SAAR).
Detailed data available upon request
Source: CMHC
Source: CMHC
Article source: http://www.cmhc.ca/en/corp/nero/nere/2015/2015-02-09-0816b.cfm
Tags: Toronto House, Toronto Housing, Toronto Realtor