Housing Starts in Toronto Trend Higher in October 2015
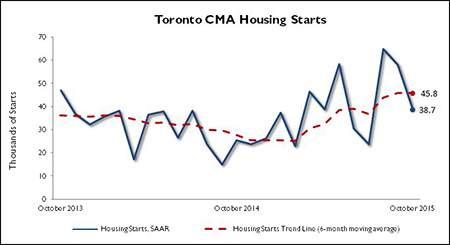
Posted by: Toronto Real Estate Admin / Category: News BulletinTORONTO, November 9, 2015 — Housing starts in the Toronto Census Metropolitan Area (CMA) trended at 45,765 units in October compared to 45,782, in September according to Canada Mortgage and Housing Corporation (CMHC). The trend is a six month moving average of the monthly seasonally adjusted annual rates (SAAR)1 of housing starts.
“Single-detached and condominium apartment starts trended higher in October,” said Dana Senagama, CMHC Principal Market Analyst for the GTA. “Tight conditions in the resale market for single-detached homes have caused demand to spill over into the new home market. Pre-construction condo sales, which began increasing in mid-2013, are also converting to starts.”
CMHC uses the trend measure as a complement to the monthly SAAR of housing starts to account for considerable swings in monthly estimates and obtain a complete picture of the state of the housing market. In some situations, analysing only SAAR data can be misleading in some markets, as they are largely driven by the multiples segment of the markets which can be quite variable from one month to the next.
The stand alone monthly SAAR was 38,722 units in October, down from 58,016 units in September. This was largely the result of a smaller number of apartment starts this month.
The City of Toronto had the highest number of total starts, most of which were apartment units. Brampton had the next highest number of starts with single-detached home starts dominating construction, followed by Mississauga where apartment starts dominated construction.
Preliminary Housing Starts data is also available in English and French at the following link: Preliminary Housing Starts Tables.
As Canada’s authority on housing, CMHC contributes to the stability of the housing market and financial system, provides support for Canadians in housing need, and offers objective housing research and information to Canadian governments, consumers and the housing industry.
1 All starts figures in this release, other than actual starts and the trend estimate, are seasonally adjusted annual rates (SAAR) — that is, monthly figures adjusted to remove normal seasonal variation and multiplied by 12 to reflect annual levels. By removing seasonal ups and downs, seasonal adjustment allows for a comparison from one season to the next and from one month to the next. Reporting monthly figures at annual rates indicates the annual level of starts that would be obtained if the monthly pace was maintained for 12 months. This facilitates comparison of the current pace of activity to annual forecasts as well as to historical annual levels.
Follow CMHC on Twitter @CMHC_ca
Information on this release:
Media Contact:
Angelina Ritacco
416-218-3320
aritacco@cmhc.ca
Additional data is available upon request.
Source: CMHC
1 Census Metropolitan Area
2 The trend is a six-month moving average of the monthly seasonally adjusted annual rates (SAAR).
Detailed data available upon request
Source: CMHC
Source: CMHC
Article source: http://www.cmhc.ca/en/corp/nero/nere/2015/2015-11-09-0816b.cfm
Tags: Toronto House, Toronto Housing, Toronto Realtor