Toronto Housing Starts Decrease in August 2016
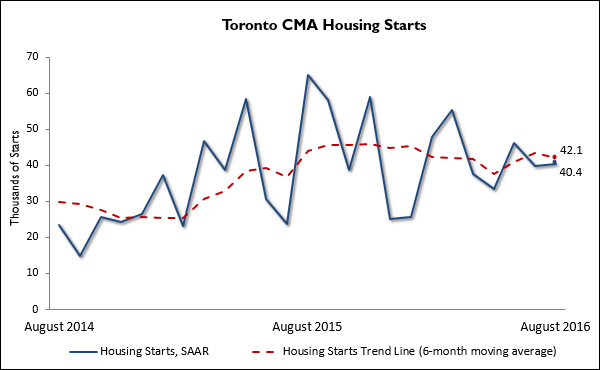
Posted by: Toronto Real Estate Admin / Category: News BulletinTORONTO, September 8, 2016 — Housing starts in the Toronto Census Metropolitan Area (CMA) trended lower at 42,103 units in August 2016 compared to 43,331 in July 2016 according to Canada Mortgage and Housing Corporation (CMHC). The trend is a six month moving average of the monthly seasonally adjusted annual rates (SAAR) of housing starts.
“Fewer apartment starts this past August are mainly responsible for a slowdown in the overall Toronto housing starts trend, in what has otherwise been a busy construction year,” said Dana Senagama, CMHC Principal Market Analyst for the GTA. “That said, limited resale listings have resulted in more buyers purchasing pre-construction homes – particularly low-rise units for which building has now begun.”
CMHC uses the trend measure as a complement to the monthly SAAR of housing starts to account for considerable swings in monthly estimates and obtain a complete picture of the state of the housing market. In some situations, analysing only SAAR data can be misleading in some markets, as they are largely driven by the multiples segment of the markets which can be quite variable from one month to the next.
The standalone monthly SAAR was 40,378 units in August, up from 39,846 units in July. The increase was mainly a result of more single-detached and row starts.
The City of Toronto recorded the highest number of starts within the Toronto CMA primarily due to apartment starts. This was followed by the City of Brampton, which had a large number of single-detached and row starts. Next was the City of Markham that had a higher number of apartment units start construction.
Preliminary Housing Starts data is also available in English and French at the following link: Preliminary Housing Starts Tables
As Canada’s authority on housing, CMHC contributes to the stability of the housing market and financial system, provides support for Canadians in housing need, and offers objective housing research and information to Canadian governments, consumers and the housing industry.
Follow us on Twitter, YouTube, LinkedIn and Facebook.
Information on This Release
Media Contact:
Angelina Ritacco
416-218-3320
Cell.: 647-210-7420
aritacco@cmhc.ca
Additional data is available upon request.
Source: CMHC
1 Census Metropolitan Area
2 The trend is a six-month moving average of the monthly seasonally adjusted annual rates (SAAR). By removing seasonal ups and downs, seasonal adjustment allows for comparison of adjacent months and quarters. The monthly and quarterly SAAR and trend figures indicate the annual level of starts that would be obtained if the same pace of monthly or quarterly construction activity was maintained for 12 months. This facilitates comparison of the current pace of activity to annual forecasts as well as to historical annual levels..
Detailed data available upon request
Source: CMHC
Source: CMHC
Article source: http://www.cmhc-schl.gc.ca/en/corp/nero/nere/2016/2016-09-09-0816c.cfm
Tags: Toronto House, Toronto Housing, Toronto Realtor